
Attribute visualization mode
Using the ShapeDiver plugin, it is possible to store attributes in various elements that are being displayed in the ShapeDiver viewer. Attributes can have multiple applications, one of which being the visualization of various properties associated with each element.
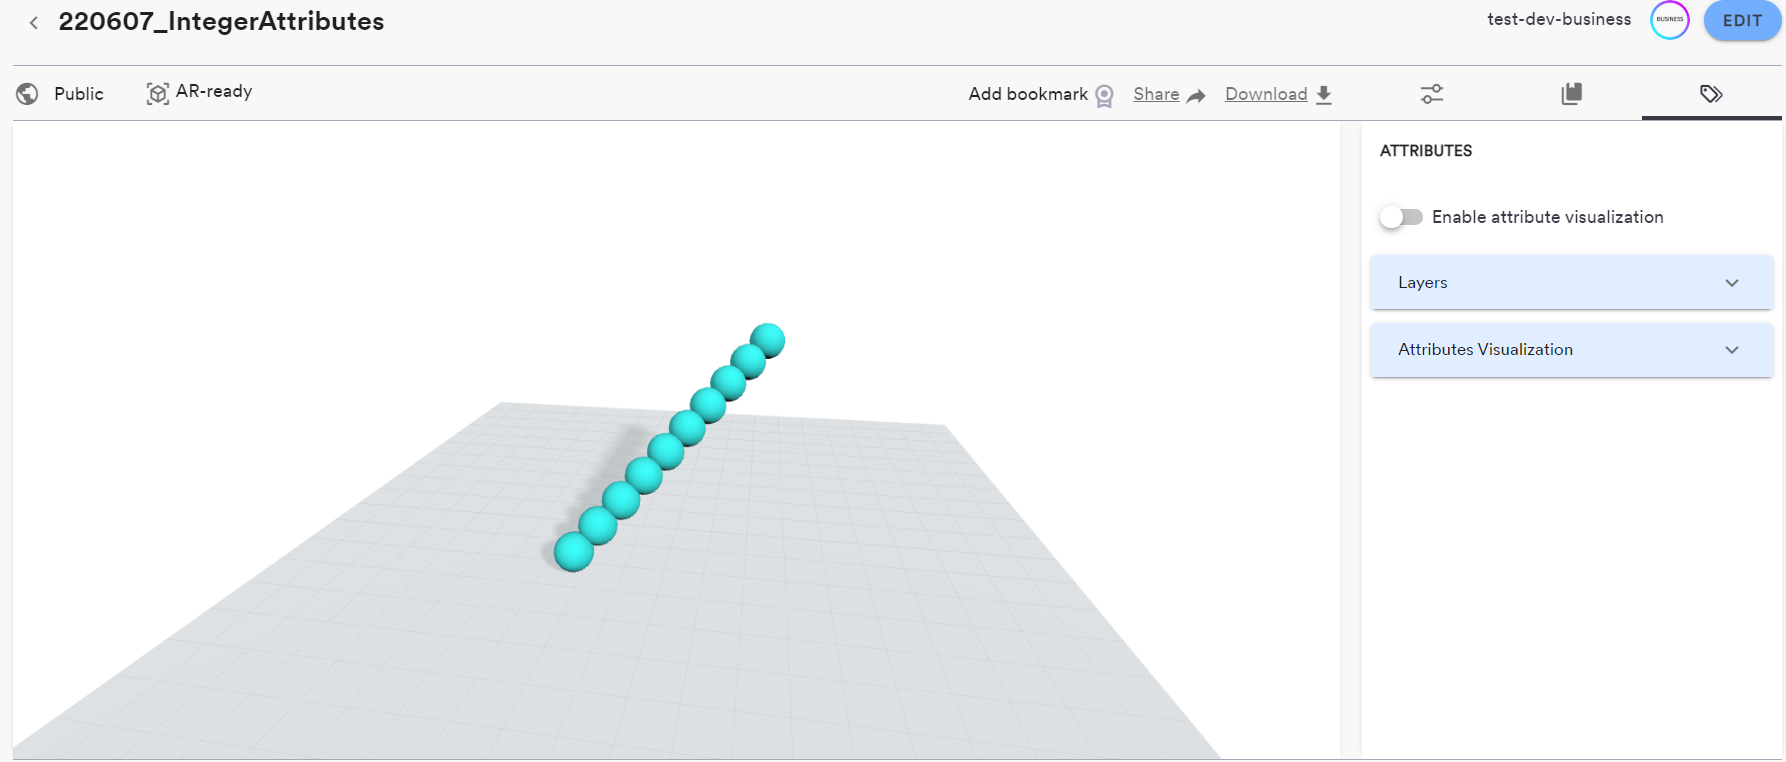
After a model is uploaded to ShapeDiver, you can access the attributes visualization mode through the control panel on the right of the model view page:
At the top of the section, use the “Enable attribute visualization” toggle to enable the visualization mode. Once the mode is turned on, two things happen:
The materials used in the standard (rendered) mode are switched off for a neutral color, preparing the geometry to be displayed according to the attributes they contain.
Each element of the 3d scene containing attributes is now selectable.
Once this mode is enabled, there are two ways to start visualizing attributes.
Visualize attributes manually
Open the “Visualization settings” menu in order to find a list of all attribute keys found in the model. When you select one, all objects containing this attribute will be visualized in the 3d scene according color schemes. Currently, there are several types of attributes that are compatible with visualization:
Numerical attributes (integer and floating numbers) are visualized using a color gradient that is automatically adjusted to the minimal and maximal value of the corresponding attribute in the model. Some adjustments can be made to the visualization:
Adjust the min and max values in order to adapt the gradient and ignore values outside of the specified range.
Choose between a range of color and opacity gradients for the visualization.
Color attributes are visualized with a simple material showing the color corresponding to the visualized attribute.
Text attributes are also visualized with a gradient scheme, each color corresponding to a string value in the list, the strings being ordered alphabetically.
Click on the cross next to the attribute in the list to stop visualizing it in the viewer.
Other types of attributes will be made visualizable in the future.
Visualize several attributes
It is possible to visualize several attributes at the same time in the viewer. The interface allows selecting multiple attributes and add them to the active list. Whenever an element contains more than one of the active attributes, the used visualization is defined according to the order of attributes in the active list. The topmost attribute in the list always has priority over the lower ones.
Explore attributes contained in a specific element
Once an element is selected, the attributes it contains will be displayed in the control panel on the right. On the one hand, the value of each attribute in the list can be copied using the “copy” button on the right. On the other hand, using the “eye” button will focus the visualization on the selected attribute, displaying the color gradient corresponding to the selected attribute.
https://www.loom.com/share/39448a811c0949f4a1db3cccde1cfc92If an attribute is already being visualized, the selected attribute will be moved to the top of the priority list of visualized attributes. The previously visualized attributes will not be removed from the list.
It is always possible to open the “Visualization properties” dropdown afterwards and adjust the gradient scheme as well as the extreme values to span with the gradient.
Layer attribute
Organizing geometry in different layers is a standard way to work in CAD software. For this reason, if the layer attribute is found in the model, a layer option will become available while in attributes visualization mode, in the lower left corner of the viewer:
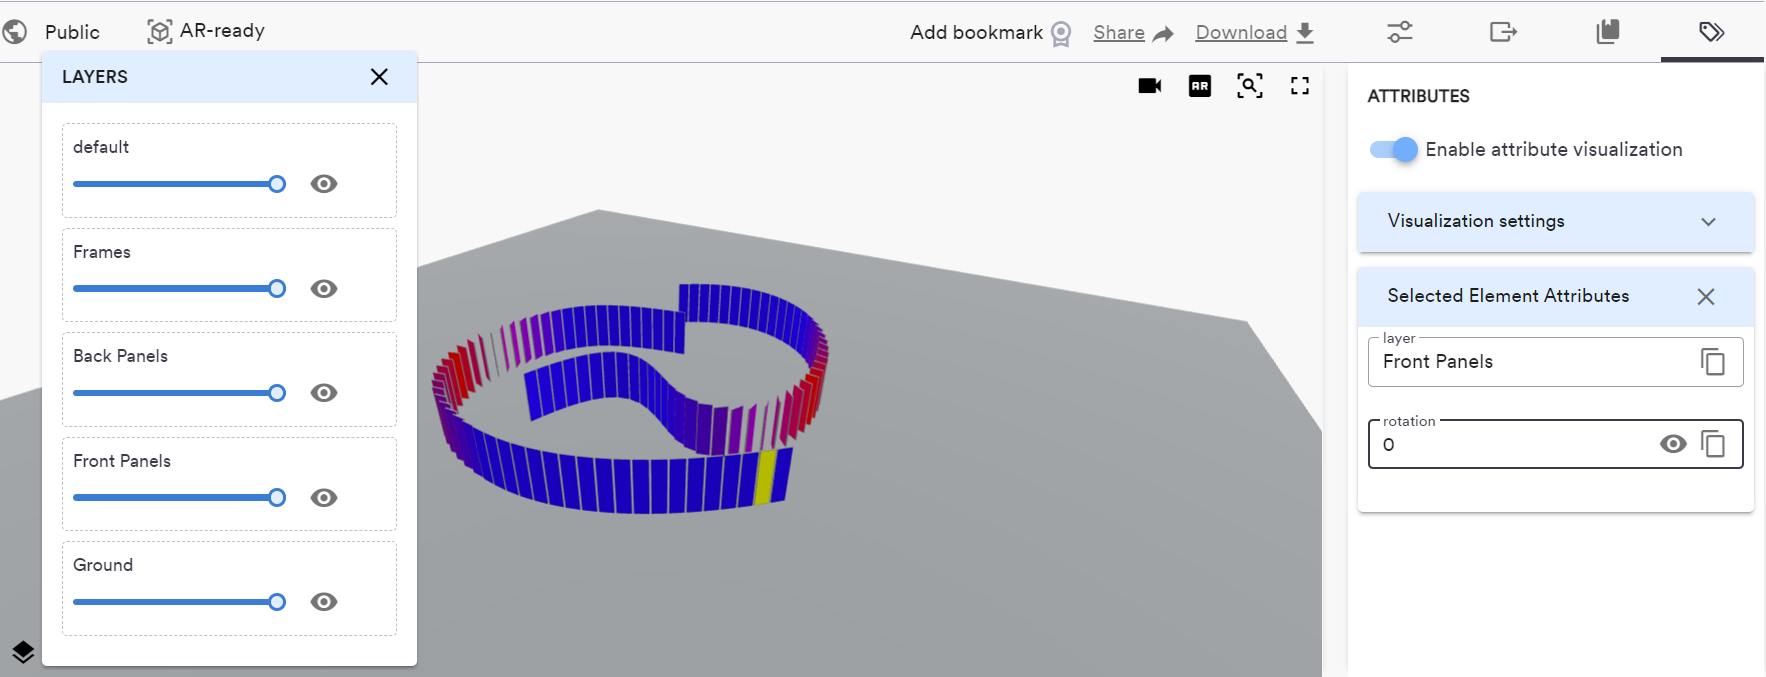
Each layer can be switched on and off or made partially transparent using the opacity slider.